Profiling MinGW Apps - Part 1
If you've tried to profile Windows apps built with a MinGW toolkit you've likely run into a couple of problems. Either your profiler doesn't understand MinGW's debug symbols, or the profiler is so intrusive that you can't build the application you're trying to profile.
A number of well-known and useful profilers such as Windows Performance Tools
only understand binaries with debug information in PDB files. Your poor MinGW
application built with -g, -ggdb, or -gstabs sadly can't be profiled because
the profiler simply doesn't understand the integrated debugging information. Usually
this means that assembly and/or raw memory addresses appear in the output rather than
source code and functions names. Not the easiest way to determine what's happening
in your code.
Other profilers such as gprof can be so finicky that it's next to impossible to
find the right combination of compile options required for your application to
build. Most frustrating, if you do finally discover the incantation needed to build,
you're often confronted with runtime failures such as The procedure entry point
mcount could not be located... It's maddening if it turns out that gprof just
doesn't play nicely with your app.
So I was pleased to discover that the freely avalailable AQtime Standard profiling toolkit from SmartBear Software natively understands .NET, Java, PDB, and MinGW's metadata and debug information. Check out the AQtime screencasts for some great getting started information.
Let's take AQtime Standard for a quick spin to figure out why the following C
code performs so poorly. Let's also pretend you've reviewed the source and still
can't figure out why it takes so long for the MessageBox to appear.
/* file: slowhello.c
 *
 * build with:
 *     gcc -Wall -O2 -g2 -gstabs+ -o slowhello.exe slowhello.c -luser32
 *
 */
#include <sys/stat.h>
#include <windows.h>

#define STAT_COUNT 50000

void rb_mongo_stat(const char *filename)
{
    int i, rc;
    struct _stat buf;

    for (i = 0; i < STAT_COUNT; i++)
    {
        rc = _stat(filename, &buf);
    }
}

void hello(void)
{
    rb_mongo_stat("slowhello.exe");

    MessageBox(NULL, "Hi Speedy G!", "Pokey", MB_SETFOREGROUND);
}

int main(int argc, char **argv)
{
    hello();

    return 0;
}
Profiling with AQtime follows the pattern typical with most other profilers:
- Compile your application with metadata/debug information
- Create a "project" in the AQtime tool with profiling setup and configuration information
- Run the application to be profiled
- Analyze the results
I'll assume you've successfully installed AQtime. If you don't already have a
MinGW toolchain installed, swing over to the RubyInstaller project and download
the DevKit for a quick and painless install.
After following the installation instructions, don't forget to add the DevKit to
your PATH environment variable by running somthing similar to:
c:\cdev>\Devkit\devkitvars.bat
Adding the DevKit to PATH...

c:\cdev>
Compiling for Profiling
The only trick here is to ensure you compile with the -gstabs+ build option.
For example, compile the example code like:
c:\cdev>gcc -Wall -O2 -g2 -gstabs+ -o slowhello.exe slowhello.c -luser32

c:\cdev>
Creating and Profiling an AQtime Project
The SmartBear's AQtime documentation
has more detailed info on how to create a project, but a quick way to create a project
is to use the File -> New Project From Module... dialog and select the slowhello.exe
app you just built. As this test app is simple and doesn't depend on other custom DLLs
you simply need to add the slowhello.exe module to the project.
If your app was more complex and depended upon other custom DLLs you would need to
add those DLLs to the project. Although slowhello.exe depends upon msvcrt.dll,
kernel32.dll, and user32.dll you do not need (or want) to add these Windows
system DLLs to your project.
For a project this simple, no additional configuration is required. Simply press
the F5 key, click on the green run icon, or select the Run -> Run menu item
to start profiling the slowhello.exe app. After accepting the defaults for a
couple of AQtime dialogs, slowhello.exe's dialog box will appear. Click OK
and AQtime will complete it's profiling and show it's results in both a Summary
tab view and a Report tab view.
With my AQtime configuration, the results from the Report tab and other views
looks like the following.
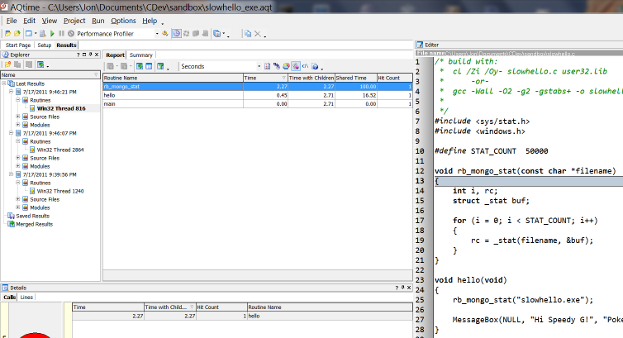
While it's almost impossible to read the results, the highlighted line near the
middle of the graphic shows that the rb_mongo_stat routine took up the most
time with 2.27 seconds followed by the hello routine taking 0.45 seconds.
Selecting each routine name changes the information displayed in the source code
view on the right and the different views (Disassembler, Parent/Child Details,
Call Graph, and Call Tree) at the bottom.
AQtime quickly showed you that the problem child causing MessageBox to be
delayed is the rb_mongo_stat function. Time to refactor that implementation
to stop unnecessarily stat-ing. A shockingly elusive result I know.
Conclusion
Although this has been a whirlwind summary of how to build and profile a very simple C program with SmartBear's AQtime Standard product, I hope you see how straight forward it can be to begin profiling your MinGW built Windows applications.
Future Post Spoiler
Now that you're a profiling expert with AQtime Standard, it's time to pick up the pace and dig into something a bit more challenging.
# file: override/aqtime_build.rb
# custom build config overrides
if ENV['AQTIME'] then
  puts '[INFO] Overriding to enable AQtime profiled Ruby 1.9.x...'

  RubyInstaller::Ruby19.dependencies = [ :ffi, :yaml, :zlib ]

  RubyInstaller::Ruby19.configure_options << "optflags='-O2'"
  RubyInstaller::Ruby19.configure_options << "debugflags='-g2 -gstabs+'"
end